Estimating a (simple) network with qgraph
Learn how to estimate a simple network with qgraph
By Gabriel R. R. in network psychometrics tutorials qgraph
August 7, 2021
A lot can be done with just a matrix
We’re gonna learn how to estimate a simple network with qgraph. For starters, we’re gonna need to install and/or load some packages.
load_libraries <- function(){
  if (!require("dplyr"))
    install.packages("dplyr"); library(dplyr)
  if(!require("qgraph"))
    install.packages("qgraph"); library(qgraph)
}
load_libraries()
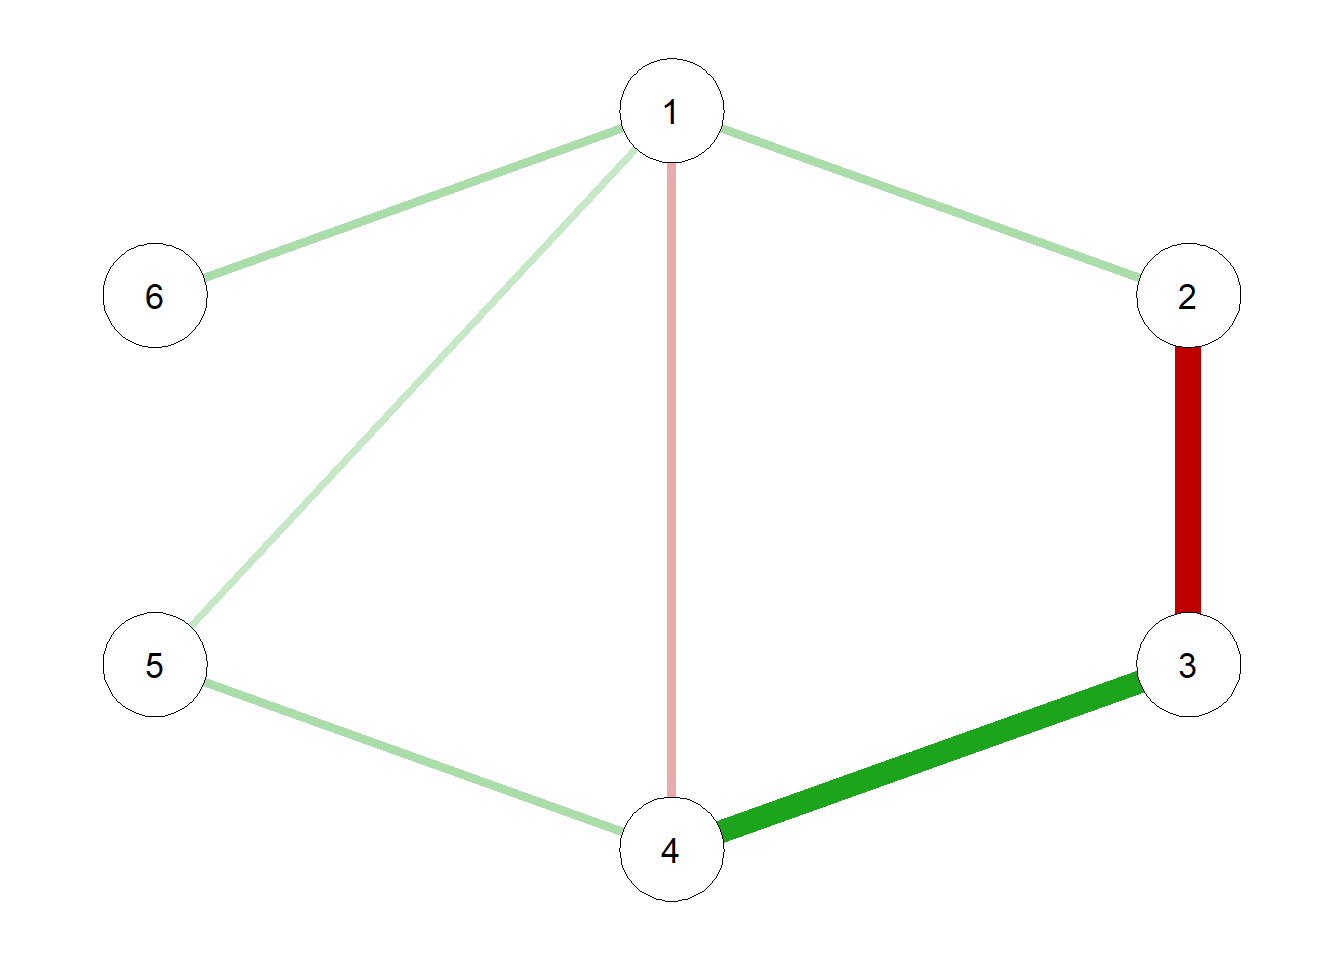
There we go! Now, say we have a symmetrical matrix called mat. This matrix could be interpreted as a mock-correlation matrix. To be fairly simple, we only need a matrix to estimate a network in qgraph.
mat <- matrix(
  c(
       0,  0.3,    0, -0.3, 0.2, 0.3,
     0.3,    0, -0.9,    0,   0,    0,
       0, -0.9,    0,  0.8,   0,    0,
    -0.3,    0,  0.8,    0, 0.3,    0,
     0.2,    0,    0,  0.3,   0,    0,
     0.3,    0,    0,    0,   0,    0
    ),
  ncol = 6, nrow = 6,
  byrow = TRUE)

network <- qgraph(mat)
Accessing layout
Ok. I think one important thing to understand is how qgraph stores the layout of the network. This is helpful, for instance, if we want to compare networks.
The layout is a rectangular matrix of Xs and Ys for each node. Let’s change the values of mat, get the layout from our initial network and then plot the network again, keeping the same exact structure from before.
mat <- matrix(
  c(
       0,  0.9,    0,  0.5, 0.2, -0.1,
     0.9,    0, -0.4,    0,   0,    0,
       0, -0.4,    0,  0.2,   0,    0,
     0.5,    0,  0.2,    0, 0.3,    0,
     0.2,    0,    0,  0.3,   0,    0,
    -0.1,    0,    0,    0,   0,    0
    ),
  ncol = 6, nrow = 6,
  byrow = TRUE)

qgraph(mat, layout = network$layout)
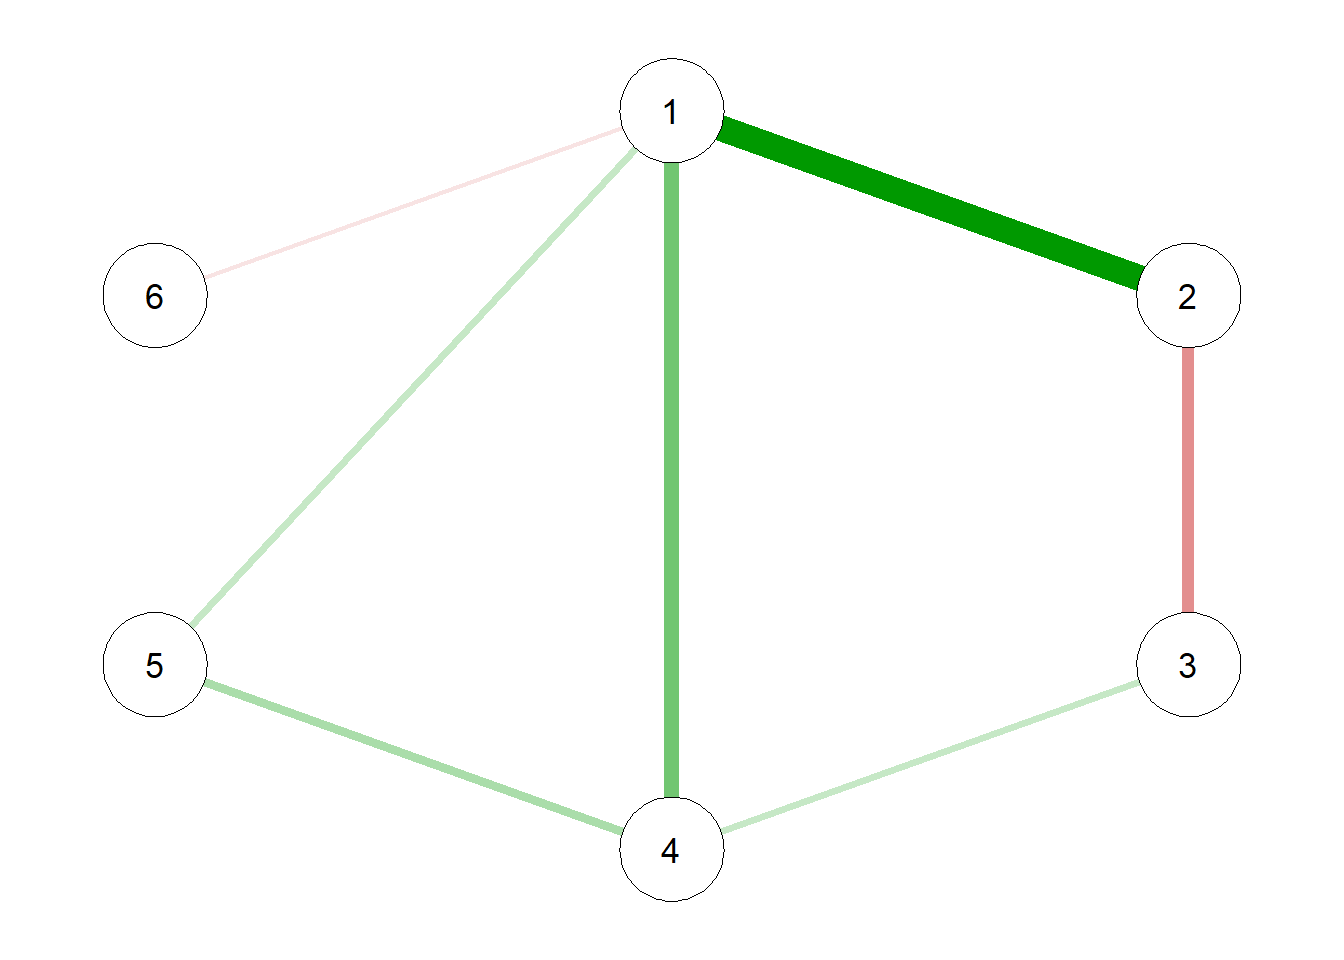
We can access the layout object using network$layout. We can use this to
change the nodes' location directly. But that isn’t common nor very useful
(except if you’re plotting a network simulation).
Saving network
The last initial step comprises saving our network in the correct way. We can’t
rely on RStudio’s Plot window because the network will try to adapt to that
window’s size. Instead, we save our network using the arguments filetype and
filename. That way, our network gets saved in our current directory. You can
also access a nested directory directly in filename.
qgraph(mat,
       layout = network$layout,
       filetype = 'png', # can be 'R', 'pdf', 'svg', 'tex', 'jpg', 'tiff', 'png'
       filename = '\\figures\\network', # opens 'figures' paste and saves there
       height = 5,
       width = 5 * 1.4)
It’s important to note that, if we’re dealing with a network that has a legend, we must specify width to be 1.4 times the height.
It would look something like this:
That’s it for now :)
- Posted on:
- August 7, 2021
- Length:
- 2 minute read, 421 words
- Categories:
- network psychometrics tutorials qgraph
- See Also: