Comparing two networks' centrality indices in the same plot
By Gabriel R. R. in tutorials function centrality qgraph network psychometrics
October 11, 2021
Getting our two networks
A problem we might encounter when comparing two networks is how to report centrality indices for these two networks. In this quick tutorial, I created a function to plot centrality indices differing networks by its graph linetype.
First, let’s create two networks based on gender using the BFI dataset from the psych package.
load_libraries <- function(){
  if (!require("bootnet"))
    install.packages("bootnet"); library(bootnet)
  if (!require("dplyr"))
    install.packages("dplyr"); library(dplyr)
  if (!require("magrittr"))
    install.packages("magrittr"); library(magrittr)
  if (!require("psych"))
    install.packages("psych"); library(psych)
  if (!require("qgraph"))
    install.packages("qgraph"); library(qgraph)
}

load_libraries()

# Data:
df <- bfi[,1:26]

df$gender %<>% factor(levels = 1:2,
                      labels = c("Male", "Female"))

# Estimating networks:
network_male <- estimateNetwork(df %>%
                                  filter(gender == "Male") %>%
                                  select(-gender),
                                default = "EBICglasso",
                                corMethod = "spearman")

network_female <- estimateNetwork(df %>%
                                    filter(gender == "Female") %>%
                                    select(-gender),
                                  default = "EBICglasso",
                                  corMethod = "spearman")
Comparing two centrality indices
Now that we have our two networks, we could try and compare centrality indices. The function below could help with that:
compareCentrality <- function(net1, net2,
                              include = c("Strength",
                                          "Closeness",
                                          "Betweenness",
                                          "ExpectedInfluence",
                                          "all",
                                          "All"),
                              orderBy = c("Strength",
                                          "Closeness",
                                          "Betweenness",
                                          "ExpectedInfluence"),
                              decreasing = T,
                              legendName = '',
                              net1Name = 'Network 1',
                              net2Name = 'Network 2'){

  library(ggplot2)
  library(forcats)

  if(include == "All" | include == "all"){
    include = c("Strength",
                "Closeness",
                "Betweenness",
                "ExpectedInfluence")
  }

  df <- centralityTable(net1, net2) %>% filter(measure %in% include)

  df %>%
    mutate(graph = case_when(graph == 'graph 1' ~ net1Name,
                             graph == 'graph 2' ~ net2Name),
           graph = as.factor(graph),
           node = as.factor(node)) %>%

    mutate(node = fct_reorder(node, value)) %>%

    ggplot(aes(x = node, y = value, group = graph)) +

    geom_line(aes(linetype = graph), size = 1) +

    labs(x = '', y = '') +

    scale_linetype_discrete(name = legendName) +

    coord_flip() +

    facet_grid(~measure) +

    theme_bw()

}
Now that we created the function, let’s use all its arguments and see what it does.
compareCentrality(network_male, network_female,
                  include = "all",
                  legendName = "Networks by Gender",
                  net1Name = "Male",
                  net2Name = "Female")
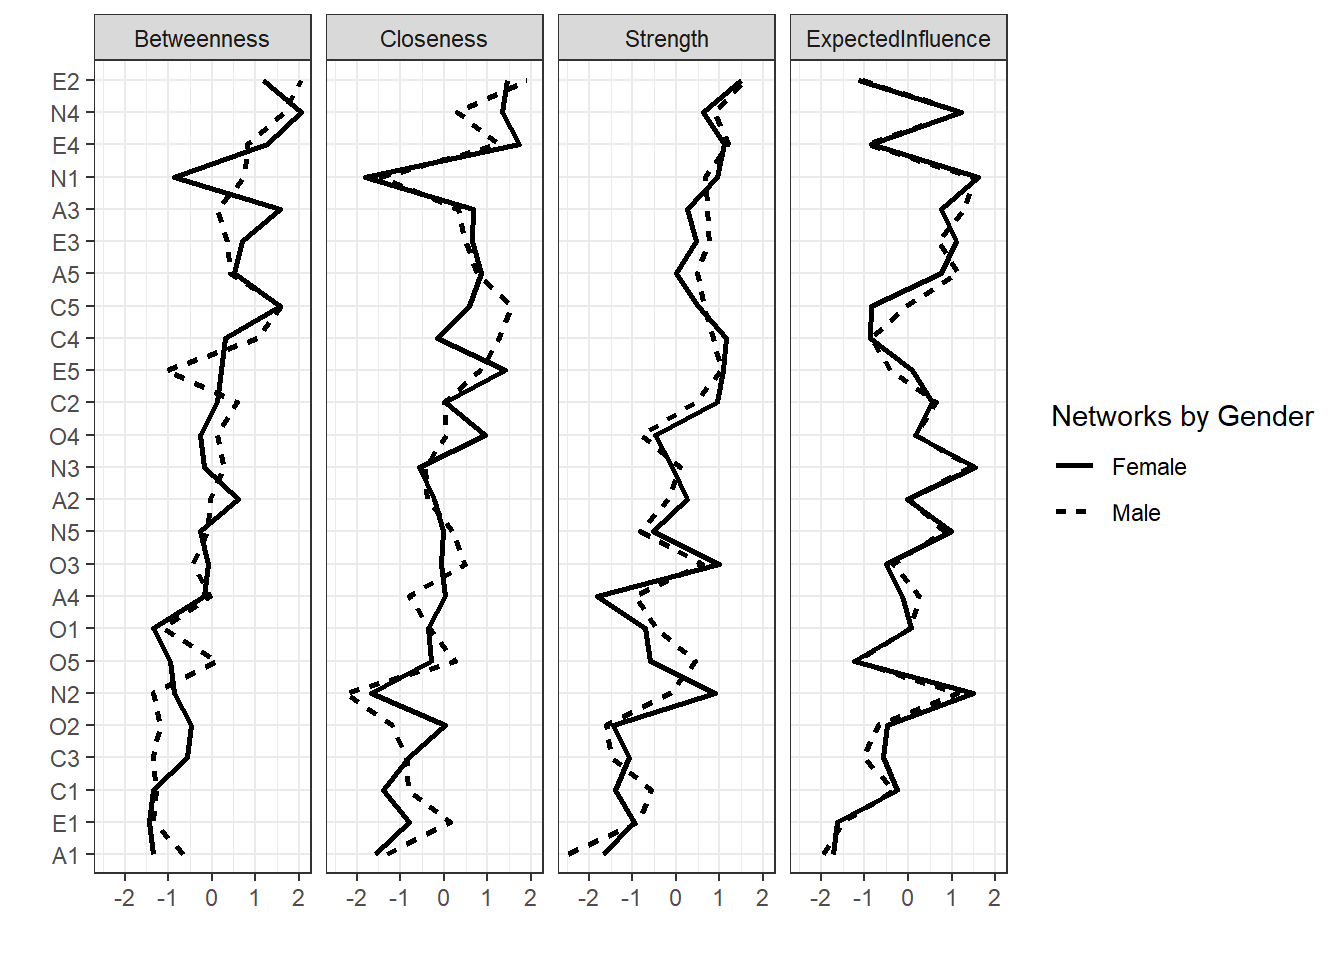
There we go! Now we have plotted our centrality measures on both networks at the same time :)
- Posted on:
- October 11, 2021
- Length:
- 2 minute read, 322 words
- Categories:
- tutorials function centrality qgraph network psychometrics
- See Also: